
Third-Party Risk Management Metrics That Prove Your Program Works

Third-Party Risk Management Metrics That Prove Your Program Works

Someone on your leadership team is going to ask what the TPRM program actually did last year. If the honest answer is "nothing bad happened," that could mean the program is working, or it could mean nobody would notice if it wasn't. Right now, you have no way to prove which one is true.

Two metrics fix that, and neither one needs an incident first. Almost no team produces either one.

Count Every Supplier, Then Report a Fraction 

If your last report to leadership included a line like "we assessed 340 suppliers," it told them almost nothing. Three hundred and forty could be strong coverage or a rounding error, and the sentence gives no way to tell which. 

Pull your supplier master. Count every supplier you actually transacted with in the trailing twelve months. That is your denominator. Report your assessed count as a fraction of it: 340 of 1,200, not 340. 

Then do it again for your critical tier alone: the suppliers with banking access, system access, or regulatory exposure. Report that fraction separately from the total. A strong number for the whole base can sit on top of a weak number for exactly the suppliers where a gap costs the most, and reporting one fraction for everyone hides the second one. 
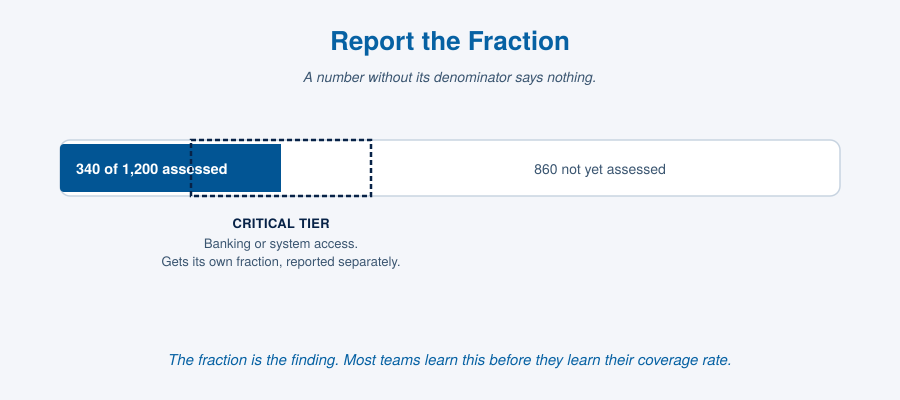
A chart titled Report the Fraction, on a light blue-gray background. A horizontal bar represents all suppliers transacted with in the last twelve months, labeled "340 of 1,200 assessed" in a blue segment on the left and "860 not yet assessed" across the white remainder. A dashed navy bracket straddles the boundary between the two, marking the critical tier, suppliers with banking or system access, without claiming how much of that tier falls on either side, captioned "Gets its own fraction, reported separately." A caption beneath reads: the fraction is the finding, most teams learn this before they learn their coverage rate.
Click image to enlarge

Start Logging Every Intervention 

Coverage tells you how much ground the program watches. It does not tell you whether the program does anything when it finds a problem. That takes a second number, produced by instrumenting the process to record what it actually stops. 

Every time your process catches something that would otherwise have gone through, log it: a supplier that never made it past screening, and a bank-detail change flagged and verified before the payment went out. 

Total the log every quarter and break it out by type. "The process caught six altered bank details this quarter and stopped payment on each one" is a specific, checkable claim about a control doing its job. 

One rule matters more than the total. If a later step in your process would have caught the same thing anyway, the earlier step never really stopped it, and logging it as a catch costs more credibility than the number is worth. When it is close, count against yourself. A cautious number that survives scrutiny beats an impressive one that does not.
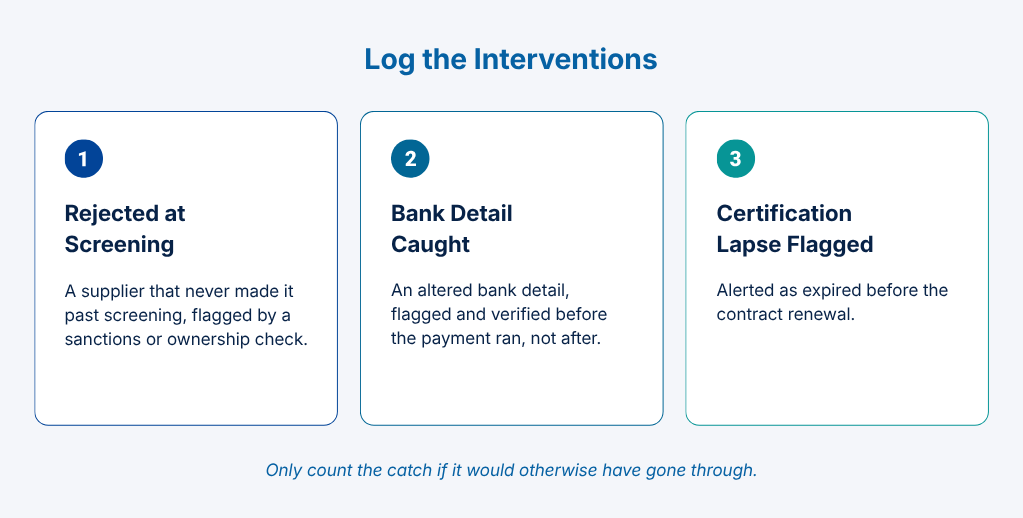
 Three panels under the heading "Log the Interventions." Panel one: "Rejected at Screening," a supplier that never made it past screening because of a sanctions or ownership flag. Panel two: "Bank Detail Caught," an altered bank detail flagged and verified before the payment ran. Panel three: "Certification Lapse Flagged," a certification flagged as expired before the contract renewal. Caption below: Only count the catch if it would otherwise have gone through.
Click image to enlarge

We cover topics like this every week. Practical supplier management insights for procurement and supply chain teams. Get it in your inbox →

Expect the First Attempt to Stall 

Most teams that try to produce these metrics hit the same wall immediately: they cannot say how many suppliers they transacted with last year. If your organization runs five different systems that do not share a supplier master, that is normal. 

The 2026 KPMG Global Third-Party Risk Management Survey of 851 organizations found that only 17% of organizations rate their own third-party risk data as fully reliable. Most are not among them. 

This is the exact gap TYS is built to close, with a Trusted Golden Record, a single, verified, enriched record for every supplier, instead of the fragmented versions each system holds separately. See how that plays out across a cross-functional team → 

Treat the stall as your first finding rather than a blocker. "We could not state how many suppliers we transacted with last year without pulling it manually across five systems" is itself a sentence worth putting in a budget conversation.

Put Both Metrics to Work 

If you are building a funding case for the gaps these numbers expose, they belong directly in the "what it exposes us to" field. A stated fraction is harder to wave off than a general concern. If you are simply trying to prove this year's budget earned its keep, report both fractions and both counts every quarter, whether anything dramatic happens or not. Numbers that hold steady are the boring, valuable proof that the quiet is not an accident. 

Start With What You Can Count 

If you do not yet know which gaps are creating the exposure these metrics reveal, that is the more basic problem to solve first. 

Our supplier risk checklist runs nineteen questions across supplier discovery, onboarding and qualification, fraud prevention, regulatory readiness, and audit visibility. It takes about five minutes. Your answers stay in your browser, nothing is submitted, and it returns a ranked list of your gaps with the reason each one matters. 

Take the Supplier Risk Checklist → 

Blog TPRM ROI
Previous reading
Third-Party Risk Management Metrics That Prove Your Program Works
Next reading
How to Build a Third-Party Risk Management Budget Case When There Is No ROI Number